
Acoustic product datasheets are full of numbers, but interpreting acoustic performance data is not always straightforward. Sound Reduction Index. Noise Reduction Coefficient. Weighted values. Frequency-dependent performance curves. For specifiers who are not acoustic specialists, this data can be difficult to interpret and even harder to match against a project’s requirements.
This guide explains the key acoustic performance metrics you will encounter when specifying rooftop plant screening, what they measure, and how to use them in practice.
The Decibel Scale
Before looking at specific metrics, it helps to understand how the decibel (dB) scale works, because it is not linear.
A 3dB increase represents a doubling of sound energy. A 10dB increase is perceived by the human ear as roughly twice as loud. This means that small numerical differences in acoustic performance can have a significant real-world impact.
For context, typical rooftop plant equipment generates between 65dB and 85dB at one metre. A quiet residential area at night might have a background level of 30dB to 35dB. The job of acoustic screening is to bridge that gap at the receptor.
Key Metrics Explained
How These Metrics Work Together
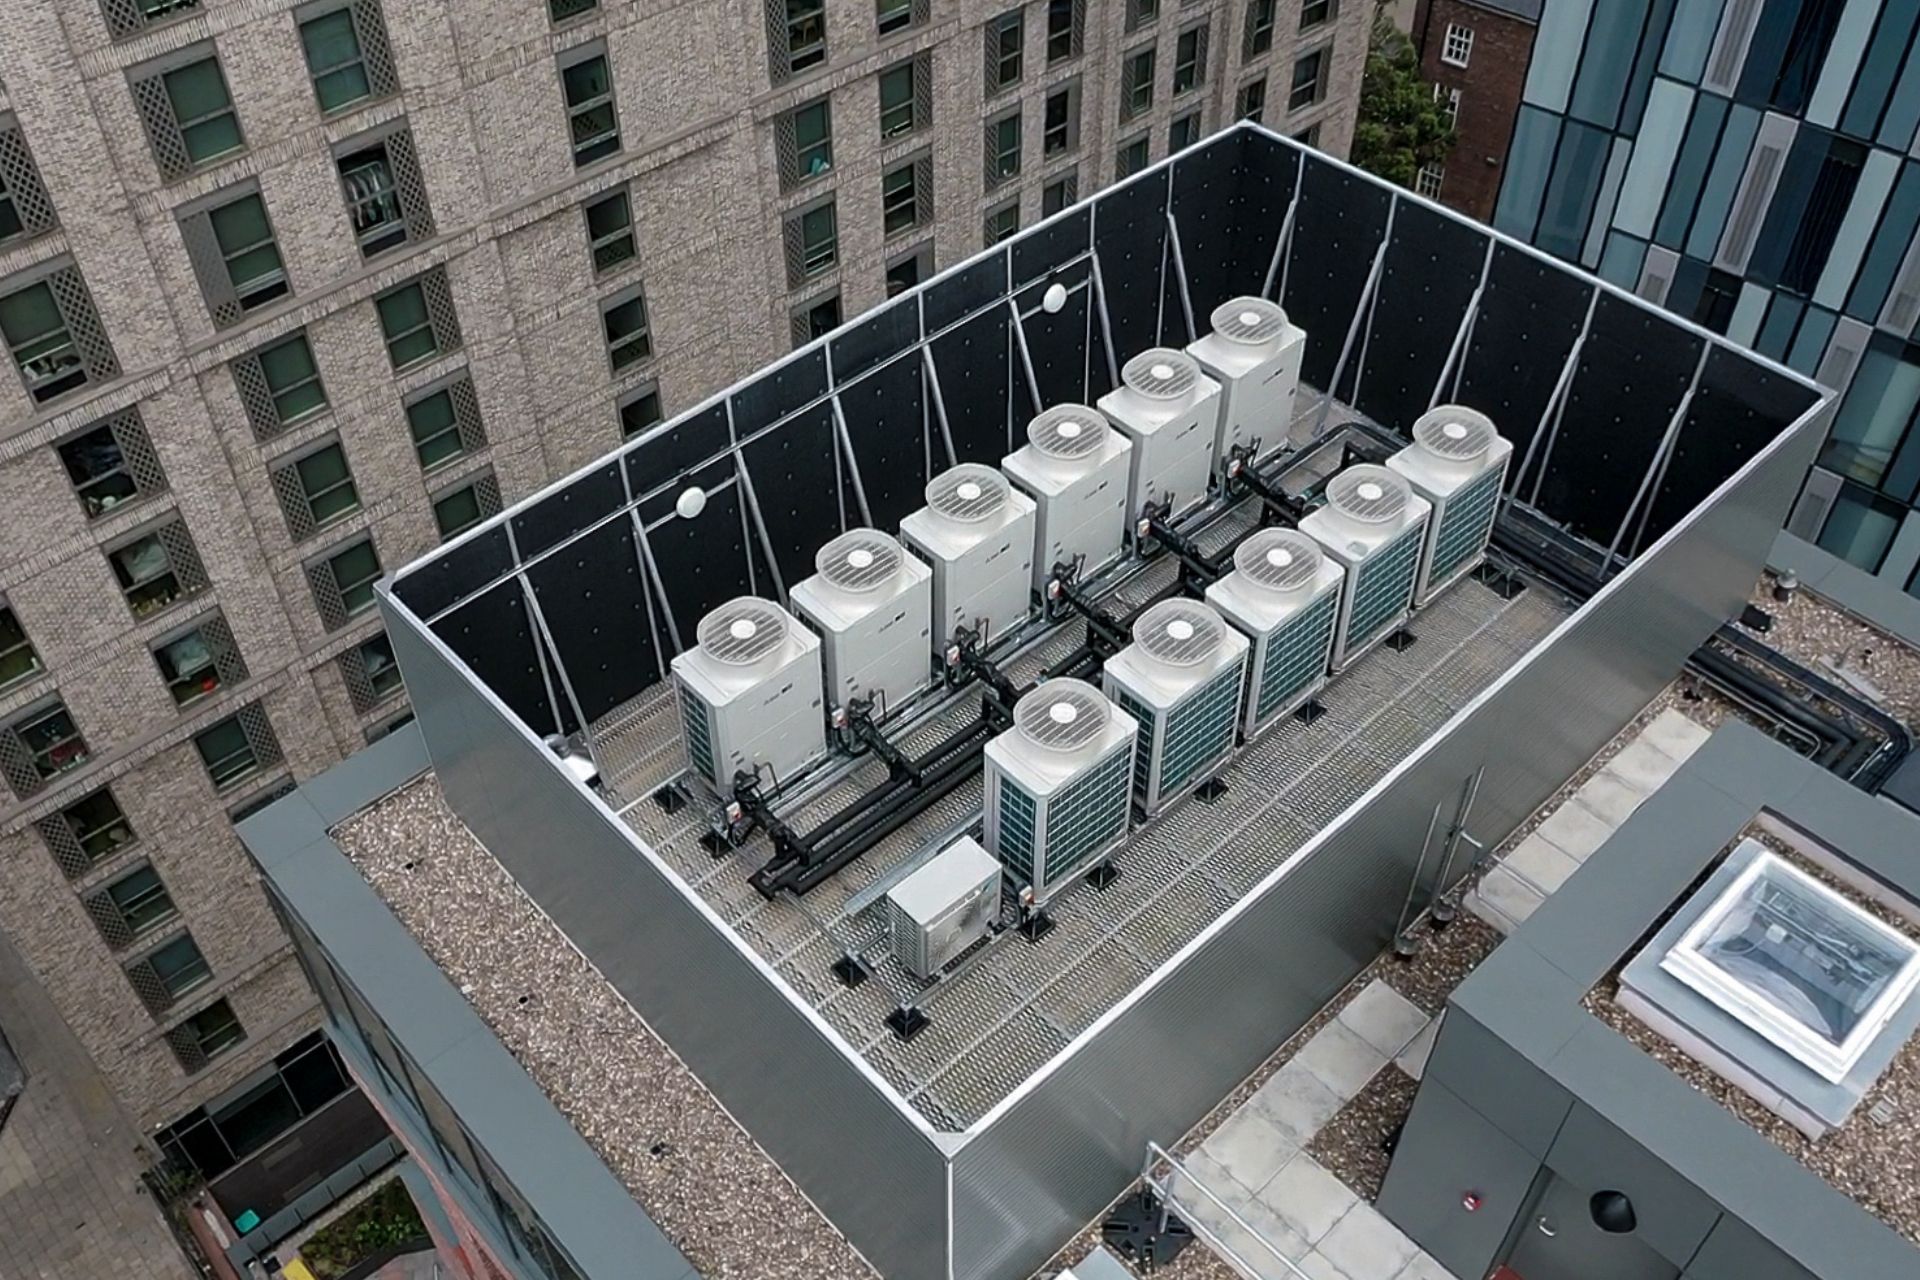
No single metric tells the full story. A panel with a high Rw but no absorption (NRC near 0) will block sound from passing through but reflect it back inside the enclosure. That reflected energy can then escape through louvre openings or gaps at a higher level.
This is why combined systems like Acoustic+ are effective. With Rw 33dB and NRC 1.0, it both blocks transmission through the panel and absorbs energy on the interior face, reducing the total sound that can escape through any path.
Practical rule of thumb:
If your enclosure has solid panels on some elevations and louvres on others (which most do), the louvre elevation is the weakest acoustic path. Maximising absorption on the solid panels (high NRC) reduces the energy available to escape through the louvres, improving the overall enclosure performance beyond what the louvre attenuation alone would suggest.
Frequency Matters
Single-number ratings like Rw and NRC are useful for comparison, but they are averages across a frequency range. In practice, acoustic performance varies with frequency.
Low-frequency noise (the deep hum from compressors and transformers) is harder to attenuate than high-frequency noise (the whine from fans and motors). Acoustic panels generally perform better at mid and high frequencies.
When reviewing product datasheets, look at the frequency-dependent performance data (usually presented in octave or third-octave bands from 125Hz to 4000Hz). If your plant equipment has a dominant low-frequency characteristic, check that the screening system performs adequately at those specific frequencies, not just at the weighted average.
Your acoustic consultant’s report should identify the frequency spectrum of your plant noise. Matching this against the frequency-dependent performance of the screening system is the most accurate way to confirm that the specification will meet the required insertion loss.
What Should You Look for in a Product Datasheet?
When comparing acoustic screening products, the following data points give you the clearest picture of performance.
- Rw value and test standard. Confirm that the Rw is tested to ISO 717-1 or the equivalent standard. Check the test report reference if available.
- NRC value. Especially important if the product will face the interior of the enclosure.
- Frequency-dependent data. Look for performance across 125Hz to 4000Hz at a minimum.
- Free area (for louvres). Acoustic louvres trade noise reduction against airflow. The free area percentage tells you how much ventilation the louvre allows.
- Weight per square metre. This affects structural loading on the roof.
- Fire rating. A1 (non-combustible) or B2 (flame retardant) ratings affect where the product can be used.
- Test standard compliance. BS EN 516, BS EN 1090-3, and ISO 717-1 confirm the product has been independently tested.
Matching the Data to Your Project
The acoustic consultant produces the requirement. The product datasheet provides the capability. Your job as a specifier is to match the two.
If the acoustic report specifies 15dB insertion loss at the receptor, you need a screening system with sufficient Rw to deliver that attenuation when installed at the specified height and distance. Remember that insertion loss in the real world is always lower than the panel’s laboratory Rw, because gaps, flanking paths, and enclosure geometry all reduce the effective performance.
Configured Platforms provides full acoustic datasheets for every product in our acoustic product range, including frequency-dependent performance data and test standard references. Our design team can work with your acoustic consultant to confirm that the proposed specification meets the required insertion loss target before manufacture begins.
Need acoustic datasheets or help matching performance data to your project requirements?
Contact us today or check out our recent projects and the systems we have to offer.